

DOI issue:
Egypt
DOI article:Herbich, Tomasz: Qasr el-Saga: magnetic survey, 1999
DOI Page / Citation link:https://doi.org/10.11588/diglit.41368#0185


QASR EL-SAGA
EGYPT
MAGNETIC SURVEY
The magnetic method was selected as best
suited to the project objectives. A gradio-
meter FM-36 (by Geoscan Research,
England) was used. The measuring grid
was 0.50 by 0.25 m, that is, measurements
were taken every 0.25 m along lines traced
0.50 m apart, applying the parallel mode
(instrument moving in one direction only,
that is, toward the south). The measured
units were 20 by 10 m big.
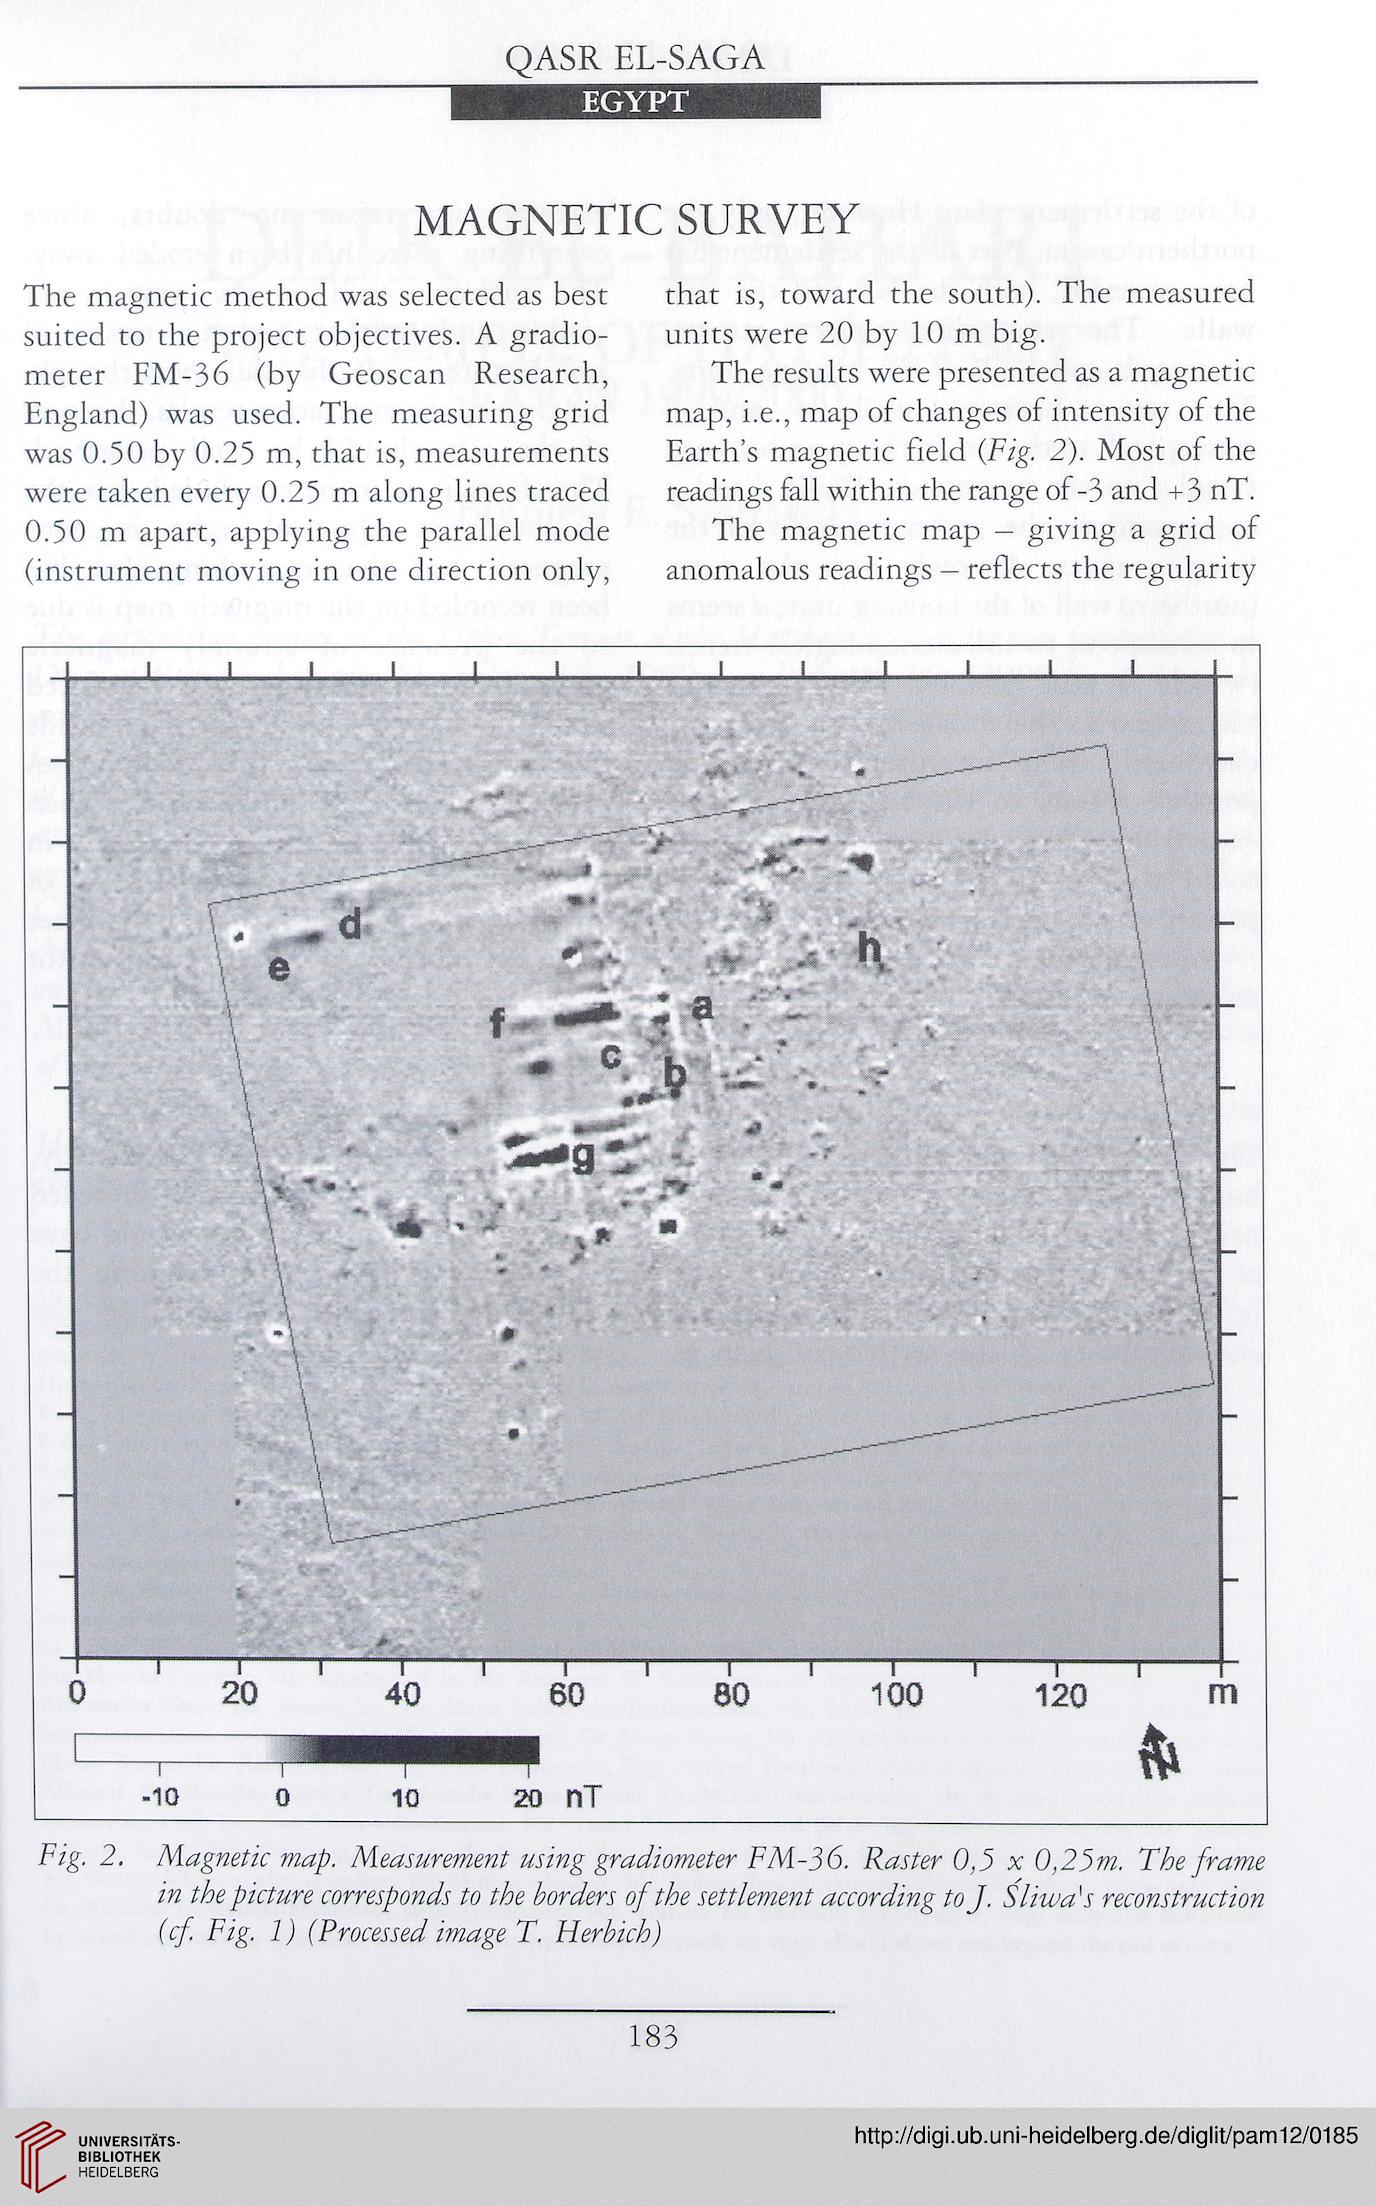
The results were presented as a magnetic
map, i.e., map of changes of intensity of the
Earth’s magnetic field (Fig. 2). Most of the
readings fall within the range of-3 and +3 nT.
The magnetic map — giving a grid of
anomalous readings - reflects the regularity
■io o io 20 nT ^
Fig. 2. Magnetic map. Measurement using gradiometer FM-36. Raster 0,5 x 0,25m. The frame
in the picture corresponds to the borders of the settlement according to J. Sliwa's reconstruction
(cf. Fig. 1) (Processed image T. Herbich)
183
EGYPT
MAGNETIC SURVEY
The magnetic method was selected as best
suited to the project objectives. A gradio-
meter FM-36 (by Geoscan Research,
England) was used. The measuring grid
was 0.50 by 0.25 m, that is, measurements
were taken every 0.25 m along lines traced
0.50 m apart, applying the parallel mode
(instrument moving in one direction only,
that is, toward the south). The measured
units were 20 by 10 m big.
The results were presented as a magnetic
map, i.e., map of changes of intensity of the
Earth’s magnetic field (Fig. 2). Most of the
readings fall within the range of-3 and +3 nT.
The magnetic map — giving a grid of
anomalous readings - reflects the regularity
■io o io 20 nT ^
Fig. 2. Magnetic map. Measurement using gradiometer FM-36. Raster 0,5 x 0,25m. The frame
in the picture corresponds to the borders of the settlement according to J. Sliwa's reconstruction
(cf. Fig. 1) (Processed image T. Herbich)
183